English
 Arabic
 French
 Spanish
 Portuguese
 Deutsch
 Turkish
 Dutch
Dutch
 Italiano
 Russian
 Romaian
 Portuguese (Brazil)
 Greek
Greek
 Social Networth OS
 Creator Commerce
 Launch Startup
 Global News
 Creator Award
 Talkfever App

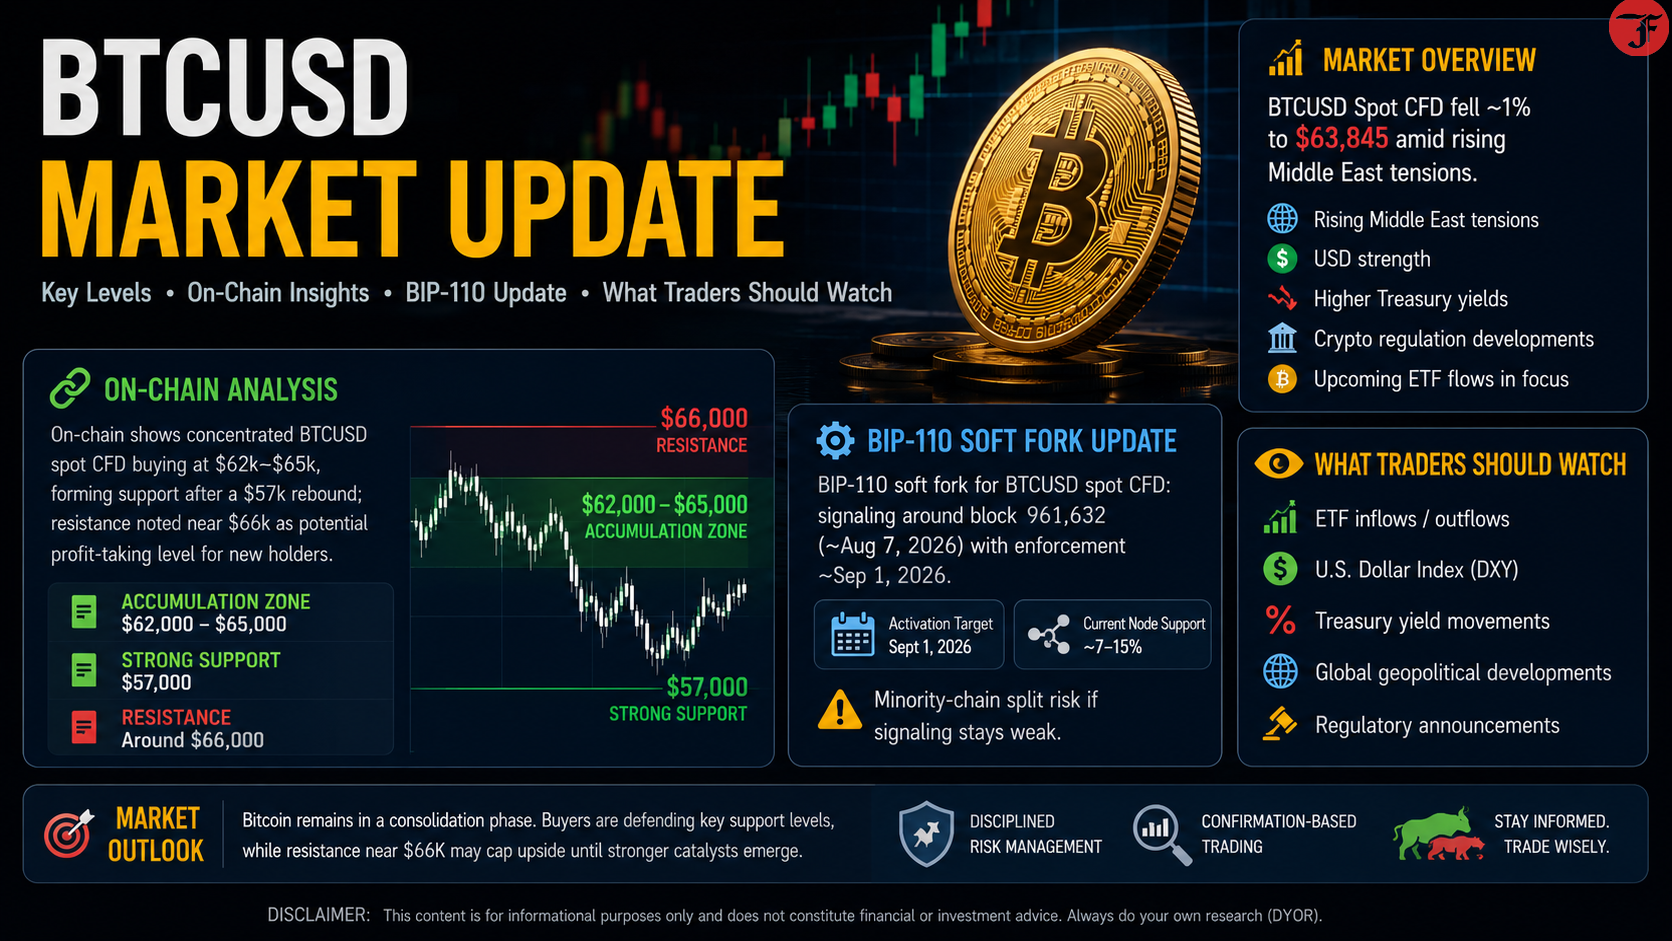
🚨 BTCUSD Market Update: Key Levels Every Crypto Trader Should Watch 📊💰
Bitcoin is navigating a wave of uncertainty as macroeconomic pressure and geopolitical tensions continue to influence market sentiment. While short-term volatility remains elevated, on-chain data highlights important support and resistance zones that traders should monitor closely.
📈 BTCUSD Technical & Fundamental Analysis
🔹 1️⃣ Market Overview
✅ BTCUSD Spot CFD declined approximately 1%, trading around $63,845.
The primary factors impacting today's price action include:
• 🌍 Rising Middle East geopolitical tensions
• 💵 Stronger U.S. Dollar (USD)
• 📉 Higher U.S. Treasury yields
• 🏛️ Ongoing crypto regulatory developments
• 📊 Anticipation surrounding Bitcoin ETF fund flows
These macroeconomic factors continue to drive short-term market volatility.
🔹 2️⃣ On-Chain Analysis
Blockchain data reveals significant accumulation between:
🟢 Support Zone: $62,000 – $65,000
This indicates many investors have accumulated Bitcoin within this range, making it a strong demand area.
Key Technical Levels
🟢 Major Support: $57,000
If market selling intensifies, this remains the next important structural support.
🔴 Primary Resistance: Around $66,000
Many recent buyers may begin taking profits near this level, potentially creating short-term selling pressure.
🔹 3️⃣ Network Development Update
⚙️ BIP-110 Soft Fork Progress
Current signaling indicates:
✔️ Around 961,632 (Aug. 7, 2026) signaling block achieved.
✔️ Activation target: September 1, 2026
✔️ Current node support remains approximately 15%
Until broader adoption occurs, a minority-chain split risk remains if signaling does not strengthen.
📊 Trading Levels at a Glance
🟢 Accumulation Zone: $62K – $65K
🟢 Strong Support: $57K
🔴 Resistance: Around $66K
⚠️ Watch Closely:
• ETF inflows/outflows
• U.S. Dollar Index (DXY)
• Treasury Yield movements
• Global geopolitical developments
• Regulatory announcements
💡 Market Outlook
The current market structure suggests Bitcoin remains within a consolidation phase. Buyers continue defending key support levels, while resistance near $66K may limit upside until stronger momentum or positive catalysts emerge.
Disciplined risk management and confirmation-based trading remain essential in the current environment.
📌 Key Takeaways
✅ Bitcoin remains above major long-term support.
✅ $62K–$65K continues to be an important accumulation zone.
✅ $66K is the immediate resistance to monitor.
✅ Macro events and ETF flows will likely determine the next major move.
💬 What's Your View?
📈 Will BTCUSD break above $66K and continue its bullish trend?
OR
📉 Will Bitcoin revisit the $57K support before the next rally?
👇 Share your analysis in the comments!
#Bitcoin #BTC #BTCUSD #Crypto #Cryptocurrency #BitcoinNews #CryptoNews #CryptoTrading #TechnicalAnalysis #OnChainAnalysis #Blockchain #BitcoinETF #Trading #Investing #MarketAnalysis #CryptoMarket #DigitalAssets #PriceAction #RiskManagement #FinancialMarkets
Disclaimer: This post is for educational and informational purposes only and should not be considered financial or investment advice. Always conduct your own research (DYOR) before making investment decisions.
Bitcoin is navigating a wave of uncertainty as macroeconomic pressure and geopolitical tensions continue to influence market sentiment. While short-term volatility remains elevated, on-chain data highlights important support and resistance zones that traders should monitor closely.
📈 BTCUSD Technical & Fundamental Analysis
🔹 1️⃣ Market Overview
✅ BTCUSD Spot CFD declined approximately 1%, trading around $63,845.
The primary factors impacting today's price action include:
• 🌍 Rising Middle East geopolitical tensions
• 💵 Stronger U.S. Dollar (USD)
• 📉 Higher U.S. Treasury yields
• 🏛️ Ongoing crypto regulatory developments
• 📊 Anticipation surrounding Bitcoin ETF fund flows
These macroeconomic factors continue to drive short-term market volatility.
🔹 2️⃣ On-Chain Analysis
Blockchain data reveals significant accumulation between:
🟢 Support Zone: $62,000 – $65,000
This indicates many investors have accumulated Bitcoin within this range, making it a strong demand area.
Key Technical Levels
🟢 Major Support: $57,000
If market selling intensifies, this remains the next important structural support.
🔴 Primary Resistance: Around $66,000
Many recent buyers may begin taking profits near this level, potentially creating short-term selling pressure.
🔹 3️⃣ Network Development Update
⚙️ BIP-110 Soft Fork Progress
Current signaling indicates:
✔️ Around 961,632 (Aug. 7, 2026) signaling block achieved.
✔️ Activation target: September 1, 2026
✔️ Current node support remains approximately 15%
Until broader adoption occurs, a minority-chain split risk remains if signaling does not strengthen.
📊 Trading Levels at a Glance
🟢 Accumulation Zone: $62K – $65K
🟢 Strong Support: $57K
🔴 Resistance: Around $66K
⚠️ Watch Closely:
• ETF inflows/outflows
• U.S. Dollar Index (DXY)
• Treasury Yield movements
• Global geopolitical developments
• Regulatory announcements
💡 Market Outlook
The current market structure suggests Bitcoin remains within a consolidation phase. Buyers continue defending key support levels, while resistance near $66K may limit upside until stronger momentum or positive catalysts emerge.
Disciplined risk management and confirmation-based trading remain essential in the current environment.
📌 Key Takeaways
✅ Bitcoin remains above major long-term support.
✅ $62K–$65K continues to be an important accumulation zone.
✅ $66K is the immediate resistance to monitor.
✅ Macro events and ETF flows will likely determine the next major move.
💬 What's Your View?
📈 Will BTCUSD break above $66K and continue its bullish trend?
OR
📉 Will Bitcoin revisit the $57K support before the next rally?
👇 Share your analysis in the comments!
#Bitcoin #BTC #BTCUSD #Crypto #Cryptocurrency #BitcoinNews #CryptoNews #CryptoTrading #TechnicalAnalysis #OnChainAnalysis #Blockchain #BitcoinETF #Trading #Investing #MarketAnalysis #CryptoMarket #DigitalAssets #PriceAction #RiskManagement #FinancialMarkets
Disclaimer: This post is for educational and informational purposes only and should not be considered financial or investment advice. Always conduct your own research (DYOR) before making investment decisions.
🚨 BTCUSD Market Update: Key Levels Every Crypto Trader Should Watch 📊💰
Bitcoin is navigating a wave of uncertainty as macroeconomic pressure and geopolitical tensions continue to influence market sentiment. While short-term volatility remains elevated, on-chain data highlights important support and resistance zones that traders should monitor closely.
📈 BTCUSD Technical & Fundamental Analysis
🔹 1️⃣ Market Overview
✅ BTCUSD Spot CFD declined approximately 1%, trading around $63,845.
The primary factors impacting today's price action include:
• 🌍 Rising Middle East geopolitical tensions
• 💵 Stronger U.S. Dollar (USD)
• 📉 Higher U.S. Treasury yields
• 🏛️ Ongoing crypto regulatory developments
• 📊 Anticipation surrounding Bitcoin ETF fund flows
These macroeconomic factors continue to drive short-term market volatility.
🔹 2️⃣ On-Chain Analysis
Blockchain data reveals significant accumulation between:
🟢 Support Zone: $62,000 – $65,000
This indicates many investors have accumulated Bitcoin within this range, making it a strong demand area.
Key Technical Levels
🟢 Major Support: $57,000
If market selling intensifies, this remains the next important structural support.
🔴 Primary Resistance: Around $66,000
Many recent buyers may begin taking profits near this level, potentially creating short-term selling pressure.
🔹 3️⃣ Network Development Update
⚙️ BIP-110 Soft Fork Progress
Current signaling indicates:
✔️ Around 961,632 (Aug. 7, 2026) signaling block achieved.
✔️ Activation target: September 1, 2026
✔️ Current node support remains approximately 15%
Until broader adoption occurs, a minority-chain split risk remains if signaling does not strengthen.
📊 Trading Levels at a Glance
🟢 Accumulation Zone: $62K – $65K
🟢 Strong Support: $57K
🔴 Resistance: Around $66K
⚠️ Watch Closely:
• ETF inflows/outflows
• U.S. Dollar Index (DXY)
• Treasury Yield movements
• Global geopolitical developments
• Regulatory announcements
💡 Market Outlook
The current market structure suggests Bitcoin remains within a consolidation phase. Buyers continue defending key support levels, while resistance near $66K may limit upside until stronger momentum or positive catalysts emerge.
Disciplined risk management and confirmation-based trading remain essential in the current environment.
📌 Key Takeaways
✅ Bitcoin remains above major long-term support.
✅ $62K–$65K continues to be an important accumulation zone.
✅ $66K is the immediate resistance to monitor.
✅ Macro events and ETF flows will likely determine the next major move.
💬 What's Your View?
📈 Will BTCUSD break above $66K and continue its bullish trend?
OR
📉 Will Bitcoin revisit the $57K support before the next rally?
👇 Share your analysis in the comments!
#Bitcoin #BTC #BTCUSD #Crypto #Cryptocurrency #BitcoinNews #CryptoNews #CryptoTrading #TechnicalAnalysis #OnChainAnalysis #Blockchain #BitcoinETF #Trading #Investing #MarketAnalysis #CryptoMarket #DigitalAssets #PriceAction #RiskManagement #FinancialMarkets
Disclaimer: This post is for educational and informational purposes only and should not be considered financial or investment advice. Always conduct your own research (DYOR) before making investment decisions.
·2K Visualizações
·0 Anterior