
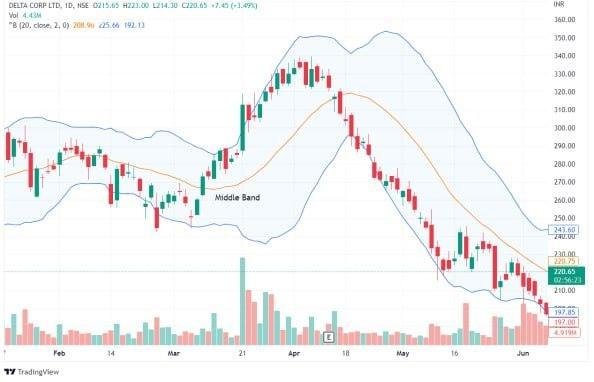
Middle Bands
The middle band is configured in many charting applications as a 20-period simple moving average.
When the stock is riding the bands, the middle line can represent areas of support on pullbacks. When the price returns to the middle line, you could increase your stock position
In terms of determining when a trend is losing steam, the failure of the stock to continue to accelerate outside of the bands indicates a weakening in the stock’s strength. This is a good time to consider quitting or leaving a position entirely
#MiddleBand #Indicator #Trading #Trade #stock #analysis
Middle Bands
The middle band is configured in many charting applications as a 20-period simple moving average.
When the stock is riding the bands, the middle line can represent areas of support on pullbacks. When the price returns to the middle line, you could increase your stock position
In terms of determining when a trend is losing steam, the failure of the stock to continue to accelerate outside of the bands indicates a weakening in the stock’s strength. This is a good time to consider quitting or leaving a position entirely
#MiddleBand #Indicator #Trading #Trade #stock #analysis

·28 Views