
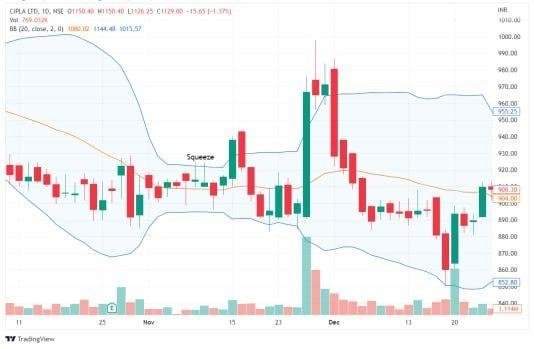
Bollinger #Band Squeeze
Another trading strategy is to predict when a squeeze will begin. Using daily charts, the idea is that when the indicator reaches its lowest level in 6 months, volatility will rise. This relates to the tightening of the bands we mentioned earlier. The #Bollinger Band #indicator ’s #squeezing action frequently foreshadows a large move.
Additional indicators, such as volume expanding or the accumulation distribution indicator rising, can be used. These additional indicators add to the evidence of a possible Bollinger Band squeeze
We need an advantage when trading a Bollinger Bands squeeze because these setups can fool even the most experienced traders
Bollinger #Band Squeeze
Another trading strategy is to predict when a squeeze will begin. Using daily charts, the idea is that when the indicator reaches its lowest level in 6 months, volatility will rise. This relates to the tightening of the bands we mentioned earlier. The #Bollinger Band #indicator ’s #squeezing action frequently foreshadows a large move.
Additional indicators, such as volume expanding or the accumulation distribution indicator rising, can be used. These additional indicators add to the evidence of a possible Bollinger Band squeeze
We need an advantage when trading a Bollinger Bands squeeze because these setups can fool even the most experienced traders
·30 Views