
What are Bollinger Bands?
John Bollinger developed Bollinger Bands, a powerful technical indicator. The bands encapsulate a stock’s price movement by providing relative highs and lows. The Bollinger Band indicator is built around a moving average, which defines the intermediate-term “trend” based on the time frame you’re looking at. However, how do we apply this indicator to trading, and what are the winning strategies?
In this post, I’ll give you a solid understanding of the bands, as well as five trading strategies to test to see which works best for your trading style.
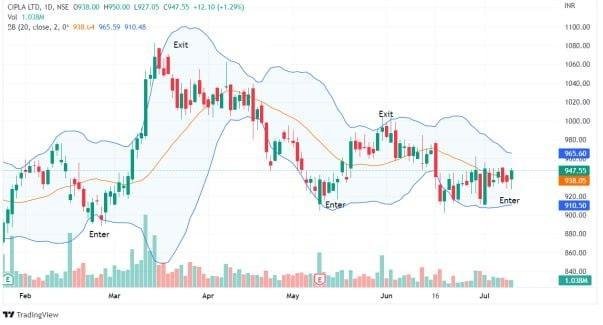
Bollinger Bands is a technical analysis tool for stock trading developed by John Bollinger in the 1980s. The bands are part of a volatility indicator that calculates the relative high and low of a security’s price in relation to previous trades.
Volatility is measured using standard deviation, which changes as volatility rises or falls. When the price rises, the bands widen, and when the price falls, the bands narrow. Bollinger Bands can be used to trade various securities due to their dynamic nature
#Indicator #BollingerBands #Guide #Trading
John Bollinger developed Bollinger Bands, a powerful technical indicator. The bands encapsulate a stock’s price movement by providing relative highs and lows. The Bollinger Band indicator is built around a moving average, which defines the intermediate-term “trend” based on the time frame you’re looking at. However, how do we apply this indicator to trading, and what are the winning strategies?
In this post, I’ll give you a solid understanding of the bands, as well as five trading strategies to test to see which works best for your trading style.
Bollinger Bands is a technical analysis tool for stock trading developed by John Bollinger in the 1980s. The bands are part of a volatility indicator that calculates the relative high and low of a security’s price in relation to previous trades.
Volatility is measured using standard deviation, which changes as volatility rises or falls. When the price rises, the bands widen, and when the price falls, the bands narrow. Bollinger Bands can be used to trade various securities due to their dynamic nature
#Indicator #BollingerBands #Guide #Trading
What are Bollinger Bands?
John Bollinger developed Bollinger Bands, a powerful technical indicator. The bands encapsulate a stock’s price movement by providing relative highs and lows. The Bollinger Band indicator is built around a moving average, which defines the intermediate-term “trend” based on the time frame you’re looking at. However, how do we apply this indicator to trading, and what are the winning strategies?
In this post, I’ll give you a solid understanding of the bands, as well as five trading strategies to test to see which works best for your trading style.
Bollinger Bands is a technical analysis tool for stock trading developed by John Bollinger in the 1980s. The bands are part of a volatility indicator that calculates the relative high and low of a security’s price in relation to previous trades.
Volatility is measured using standard deviation, which changes as volatility rises or falls. When the price rises, the bands widen, and when the price falls, the bands narrow. Bollinger Bands can be used to trade various securities due to their dynamic nature
#Indicator #BollingerBands #Guide #Trading
·21 Ansichten